About that CDC COVID-19 Death Total Discrepancy
Posted on May 4, 2020
Over the weekend I’ve received emails from friends who have shared articles and tweets which are sounding the alarm over the very large discrepancy in CDC-reported deaths when compared with the total death numbers reported on this and other sites. As of this morning, we’re reporting 67,567 deaths from COVID-19, while the CDC is showing 37,308. The difference is huge. But I believe this isn’t the smoking gun that people are claiming it to be.
Here’s a look at this same table in 4 consecutive weeks in April. You can verify this by using the Internet Archive Wayback Machine results for this page on the CDC site.
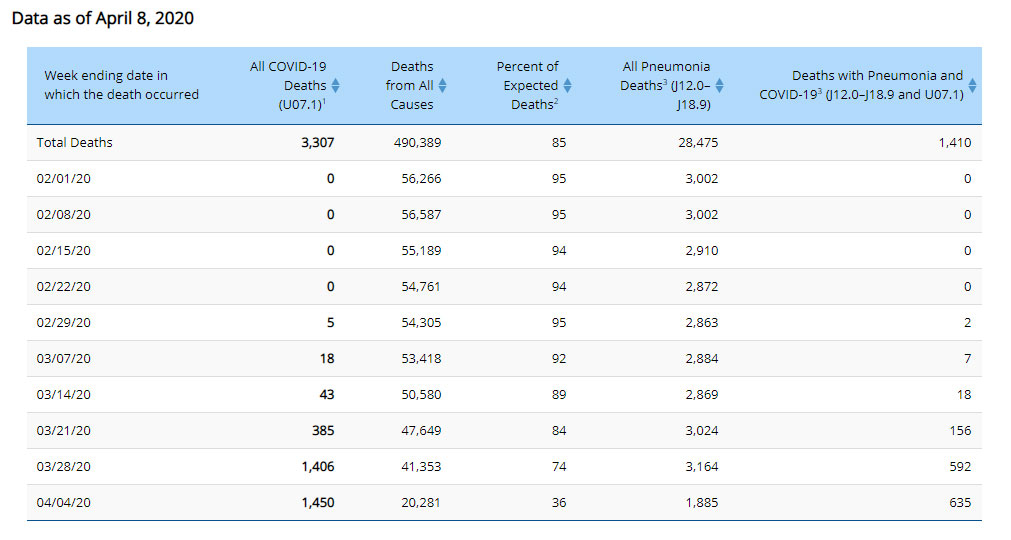
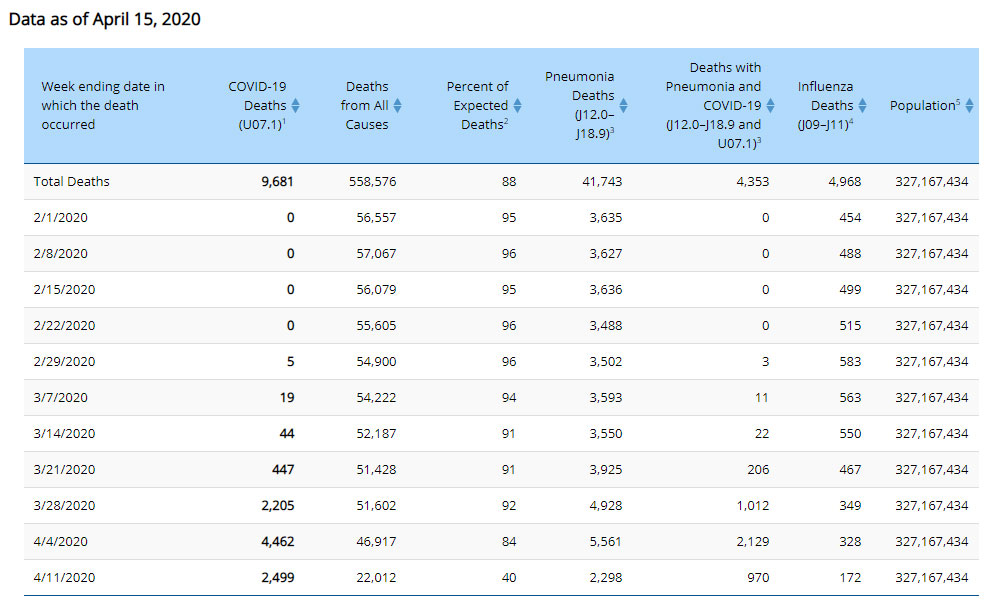
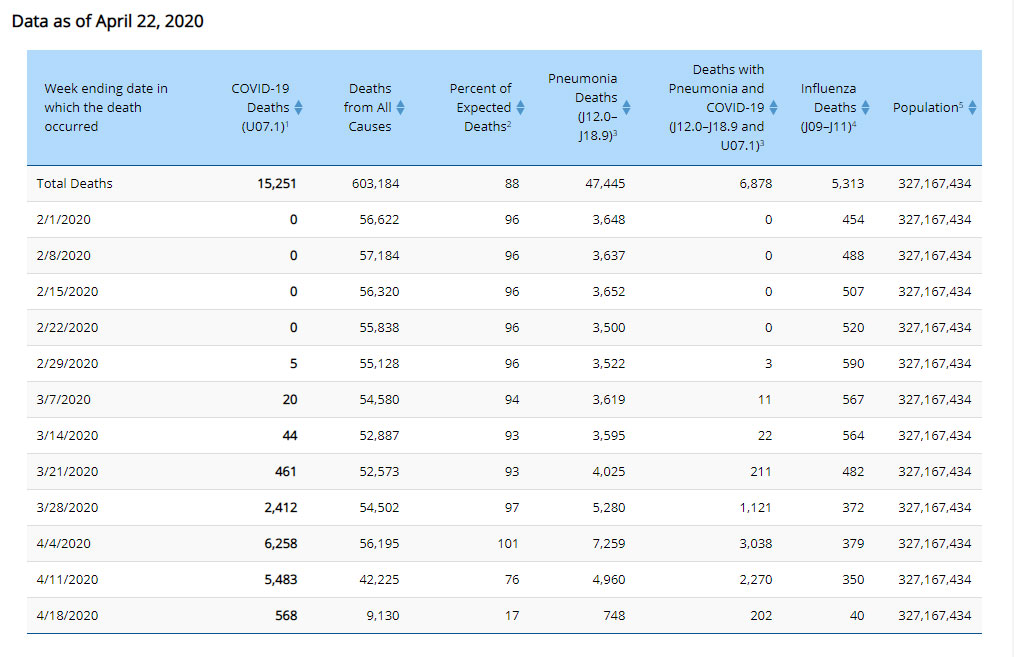
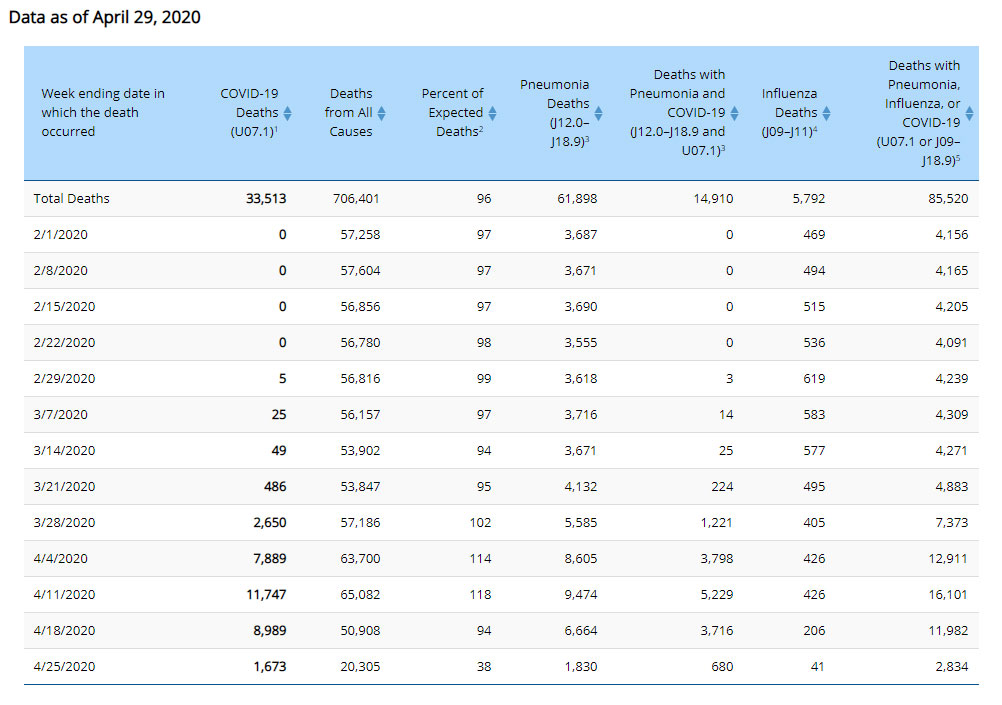
When you compare the charts you can see that this is a living document. Changes are happening constantly to every row of the table. Down below the chart there are a list of asterisks and footnotes to explain the various idiosyncracies in the data. The CDC states that it only records a death when it can verify a death certificate, and that can happen up to 8 weeks after the death occured. So this table is basically useless for the kind of analysis that is being done via recent articles and tweets.
The more interesting observations and questions seem to be:
- The footnote on Influenza deaths states that the number includes death certificates which also include COVID-19 and pneumonia. What’s the flu death count when we exclude COVID-19?
- How is it possible for the data to take up to 8 weeks to trickle down to the CDC, yet it takes less than 24 hours to be reported to the public?
- The footnote for the COVID-19 death total states that the count includes presumed COVID-19 deaths. Why isn’t the flu death count measured this way?
Overall, this chart just reminds me of goverment bureacracy: complicated, inefficient, and not extremely useful. There are lots of questions worth asking about COVID-19 data collection, but since this chart can’t provide good data it isn’t worth dwelling on.