Estimating Herd Immunity Status for Each State
Posted on August 1, 2020
A Brief Overview of Herd Immunity
The Mayo Clinic website gives the following explanation of herd immunity:
Herd immunity occurs when a large portion of a community (the herd) becomes immune to a disease, making the spread of disease from person to person unlikely. As a result, the whole community becomes protected — not just those who are immune.
In order to reach herd immunity, a certain proportion of the population, the Herd Immunity Threshold (HIT), needs to be vaccinated or exposed and have developed an immune resistance to COVID-19 in order for the spread of the disease to slow and eventually burn out.
HIT is calculated like this: HIT = (R0-1/ R0) , where R0 is equal to the average number of people who will contract the disease from someone who is already infected. When R0 reaches 1, the outbreak stops growing. When it drops below 1, the outbreak begins to burn out.
Using the HIT formula, and a CDC estimate of 2.5 for R0, we find that:
2.5 – 1 / 2.5 = .6
or
60% of the population
either needs to be effectively vaccinated or needs to contract the virus and recover with effective immune protection, in order for the R0 value to fall below 1 and cause the virus to burn itself out for lack of available hosts. 60% is a very big number, but keep reading to learn why researchers believe the true HIT is likely much lower in the case of COVID-19.
Estimated Global Infection Fatality Rate for COVID-19
One of the key factors in determining HIT is the Infection Fatality Rate, or IFR. IFR = Number of Total Deaths / Number of Total Infections. We’ve known from very early on in the pandemic that the number of COVID-19 infections is much higher than is being reported due to asymptomatic not making it to the case totals.
A recent meta-analysis of 50 international sero-prevalence studies by Stanford researcher Dr. John Ioaniddis has shown that the median infection fatality rate, or IFR, of COVID-19 is .27%. Sero-prevalence studies attempt to estimate what percentage of a population has had COVID-19 in the past, using current COVID-19 antibody testing capabilities. IFR is then calculated using the estimated prevalence (how many people have been infected) of COVID-19 in a certain area.
For example, according to the CDC’s interactive serology dashboard, the latest sero-prevalence data implies a 23.2% infection rate in New York City. New York City has a population of 8.4 million people. Using these two numbers, we can estimate that 23.2% * 8.4 million population = 1,948,800 infections have occurred in NYC thus far. We know that there have been 23,000 deaths in New York City, so if we divide 23,000 deaths / 1,948,800 infections, we come to an IFR of 1.2%, meaning that 1.2% of people in NYC who become infected by COVID-19 will die of the disease.
Why does IFR matter in terms of herd immunity? Well, if the true IFR is .27%, and we accept the traditional thinking that 60% of the population needs to be exposed to the virus or vaccinated, if we choose to not vaccinate 199 million people, 536,000 in the U.S. will die from COVID-19. A truly terrible outcome if we don’t vaccinate.
However, recent studies are showing that the HIT may actually be as low as 10-20% instead of 60-70%. This is because a huge drawback to using HIT on its own is that HIT has to assume that everyone in a population is equally susceptible to a disease and equally likely to be exposed to the disease. This drawback makes sense but it’s hard to quantify. A collaboration of researchers from around the globe attempted to understand what the true HIT is for COVID-19 and came up with this graphic:
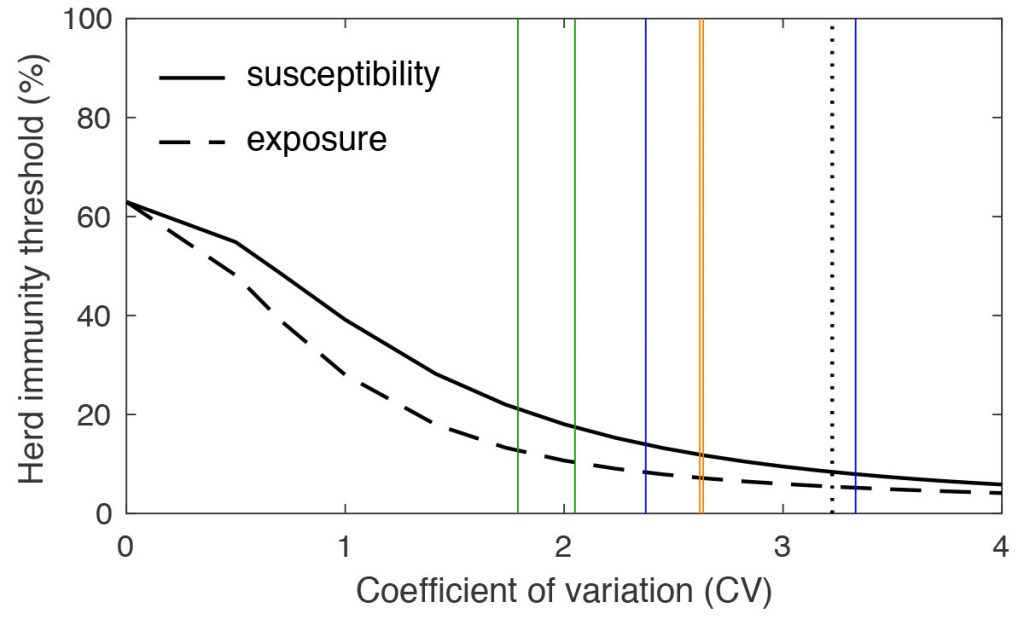
As explained in the caption, the vertical lines represent the different levels of variability in susceptibility and exposure for various diseases. The vertical black dotted line is the best estimate for COVID-19. We can see that because of the higher variability for COVID-19, the HIT lands somewhere between 10-20%. This is great news because it means that not only is it possible that we won’t need mass vaccinations, but we may already be very close to herd immunity in key areas of the U.S.
But wait a second. An HIT of 10-20% is way lower than the mainstream estimate of 60-70%. Why is the number so much lower? A recent study out of Germany shows that as many as 80% of people who come into contact with COVID-19 already have some level of T-cell immunity based on the human body’s built-up immunity to the common cold, which itself is also a type of coronavirus. So COVID-19 isn’t an example of a disease which is affecting a completely defenseless population. Quite the contrary. Most of us already have a level of resistance to the virus. These kinds of findings are significantly driving down HIT estimates.
Putting the Pieces Together
If the IFR of COVID-19 is somewhere around .27%, and the HIT is in the 10-20% range, is it possible that we’ve already reached herd immunity in several areas of the country?
Let’s take a look at an example of New York, which was clobbered in the beginning of the crisis, but has been spared from the recent surge which has plagued southern and western states.
Here’s a look at the New York daily death totals with HIT overlays;
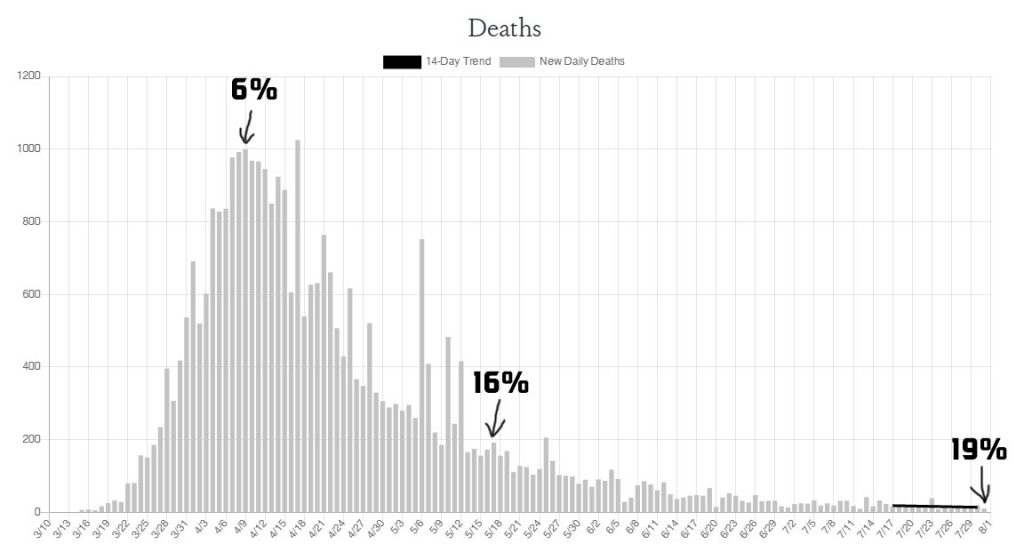
As we can see, at the peak of the daily death totals, 6% of New Yorkers are estimated to have contracted the virus. On May 17, 16% of New Yorkers had the virus. As of today 19% of New Yorkers are estimated to have contracted the virus, and COVID-19 appears to have almost completely disappeared from the state.
This same pattern is happening in other hard-hit areas of the world and is beginning to appear in other states in the U.S.
So what does this tell us about COVID-19? The main takeaway is that hiding from the virus, locking down, and imposing misguided mask policies appear to just be delaying herd immunity. We’re going to have to face this problem eventually. We’re constantly hearing promises of vaccines, but despite the positive news articles, the actual experts are still estimating that a vaccine isn’t going to realistically be available until 2022, if at all. There are absolutely no guarantees on that front.
On the other hand, if the HIT of COVID-19 is between 10-20%, as the data seems to be confirming all around the world, why shouldn’t we be encouraged by the possibility of this all ending sooner than we thought–and without mass vaccinations!
Be encouraged, friends. There’s light at the end of the tunnel. Continue to protect the vulnerable in your life and let herd immunity run its course. Then go out and live your life.
Want to see your state’s herd immunity progress? Click here for a comparison of all 50 states.